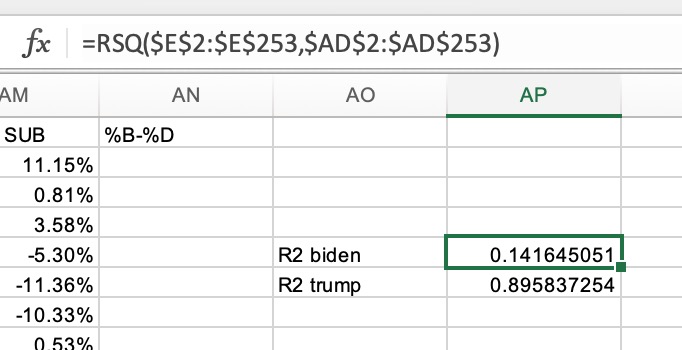
R-Squared is a number you can calculate from two sets of data that given an indication of if there’s a correlation between them, and how tight that correlation is. You can calculate this in Excel simply by using the RSQ(range1, range2) on two ranges of data (like two columns). Here I calculate it for the straight-ticket voters vs. the individual candidate voters. I do this for both Biden and Trump.
That looks a bit more complicated than it is. $E$2:$E$253 is just specifying column E ... Read even more